Small Business
Women-Owned Businesses Growing, Best States are Florida, Georgia, Michigan
Women started an average of 1,821 new businesses per day in the U.S. between 2017 and 2018, according to analysis in the 2018 State of Women-Owned Businesses Report (PDF) commissioned by American Express. This level of new business formation ...
Aug. 24, 2018

Women started an average of 1,821 new businesses per day in the U.S. between 2017 and 2018, according to analysis in the 2018 State of Women-Owned Businesses Report (PDF) commissioned by American Express. This level of new business formation by women is greater than the daily average during the pre-recession period from 2002 to 2007 (714), the recession and recovery period between 2007 and 2012 (1,143), and the post-recession period between 2012 and 2017 (952).
This year’s report explores data back to 1972 – the first time the U.S. Census Bureau provided data on minority-owned and women-owned businesses. The analysis shows that over 48 years the number of women-owned businesses increased a dramatic 31 times from 402,000 to 12.3 million in 2018. During that time, employment for these firms grew 40-fold from 230,000 to 9.2 million, and revenues rose from $8.1 billion to $1.8 trillion– 217 times greater.
“This new data demonstrates not only the remarkable impact women entrepreneurs have on our economy when it comes to creating jobs and generating revenue, but also the growing role of women-owned businesses in our communities,” said Julie Tomich, SVP, American Express Global Commercial Services. “Over the past 11 years, we’ve seen women’s entrepreneurship and economic impact increase – especially among the growing number of women-owned companies that generate more than $1 million in revenue.”
Notably in 2018, women-owned businesses that generated revenues of more than $1 million increased 46% over the past 11 years vs. 12% of all U.S. businesses. While these high-earning firms make up only 1.7% of all women-owned businesses, they now account for 68% of total employment and 69% of revenue among all women-owned businesses.
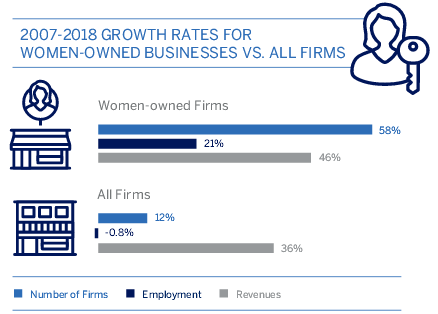
Over the past 11 years, the ratio of women-owned businesses to total businesses in the U.S. increased much faster than their employment and revenue growth. While the share of women-owned businesses leapt from 29% in 2007 to 40% in 2018, the proportion of total employment and revenues for all businesses grew by only a few percentage points. Over this period, the total proportion of employment increased from 6% to 8% and total revenues increased from 4.0% to 4.3%.
The number of firms owned by minority women has grown 163% since 2007
Since 2007, women of color have started businesses at an unmatched rate. While the number of women-owned businesses grew 58% from 2007 to 2018, firms owned by women of color grew at nearly three times that rate (163%). As of 2018, women of color account for 47% of all women-owned businesses. An estimated 5,824,300 women-of-color-owned businesses employ 2,230,600 people and generate $386.6 billion in revenues.
More specifically, numbers for Latinas and African Americans grew faster than the average rate for businesses owned by women of color: 172% and 164% respectively, equaling 2.1 million Latina-owned and 2.4 million African American women-owned businesses in 2018.
Native Hawaiian/Pacific Islander, Asian American and Native American/Alaskan women-owned businesses grew slower than for women of color in general but faster than overall women-owned businesses. There are 36,800 Native Hawaiian/Pacific Islander owned firms, representing 146% growth since 2007. Asian American women-owned firms grew 105% corresponding to 1 million firms and Native American/Alaskan women-owned firms grew 76% to 169,500 businesses.
The report estimates that if revenues generated by minority women-owned firms matched those currently generated by all women-owned businesses, they would add four million new jobs and $1.2 trillion in revenues to the U.S. economy.
Geographic trends for U.S. women-owned businesses
The report analyzes geographic trends for all 50 states (including District of Columbia), as well as the 50 most populous metropolitan areas in the U.S.
The states with the fastest growth rate in terms of the number of women-owned firms between 2007 and 2018 are:
1. Florida
2. Georgia
3. Michigan
4. Tennessee (tie)
4. South Carolina (tie)
This report examined economic clout, a measure that includes the growth in the number of women-owned firms, employment and revenues. The states where women-owned businesses most increased their economic clout between 2007 and 2018 are:
1. South Dakota
2. Texas (tie)
2. Utah (tie)
4. Delaware
5. North Dakota (tie)
5. Tennessee (tie)
The top metropolitan areas where women-owned businesses increased their economic clout from 2007 to 2018 are:
1. Charlotte-Concord-Gastonia metro area, NC/SC
2. San Antonio, TX
3. Austin, TX
4. Indianapolis, IN
5. Miami, FL
The states showing the highest employment vitality – a measure of employment growth rate from 2007 to 2018 at women-owned firms and their average number of employees are:
1. Minnesota
2. Maine (tie)
2. North Dakota (tie)
4. Iowa
5. Delaware (tie)
5. Virginia (tie)
A look at U.S. women business owners of different ages
New this year, the report examined generational trends among women business owners. Nearly half of women business owners are between the ages of 45 and 65 (48%) and two thirds (67%) are 45 or older. The next largest age group, 25-44 years old, account for 31% of women business owners.
Distinctive trends emerge when racial and ethnic groups are analyzed by generations:
- African American women business owners tend to be younger: four out of ten (39%) were millennials or younger generations (under 35).
- Gen Xers (ages 35 to 54) represented the highest concentration of Latina business owners (53%) and Asian American women-business owners (54%).
- Native American/Alaska Native business owners were more likely to be older, between the ages of 45 and 64 (47%).
- Native Hawaiian/Pacific Islander women business owners were more evenly divided between age categories ranging from 25 to 54 (70%).
Explore the 2018 State of Women-Owned Businesses Report, in pdf format, here.
