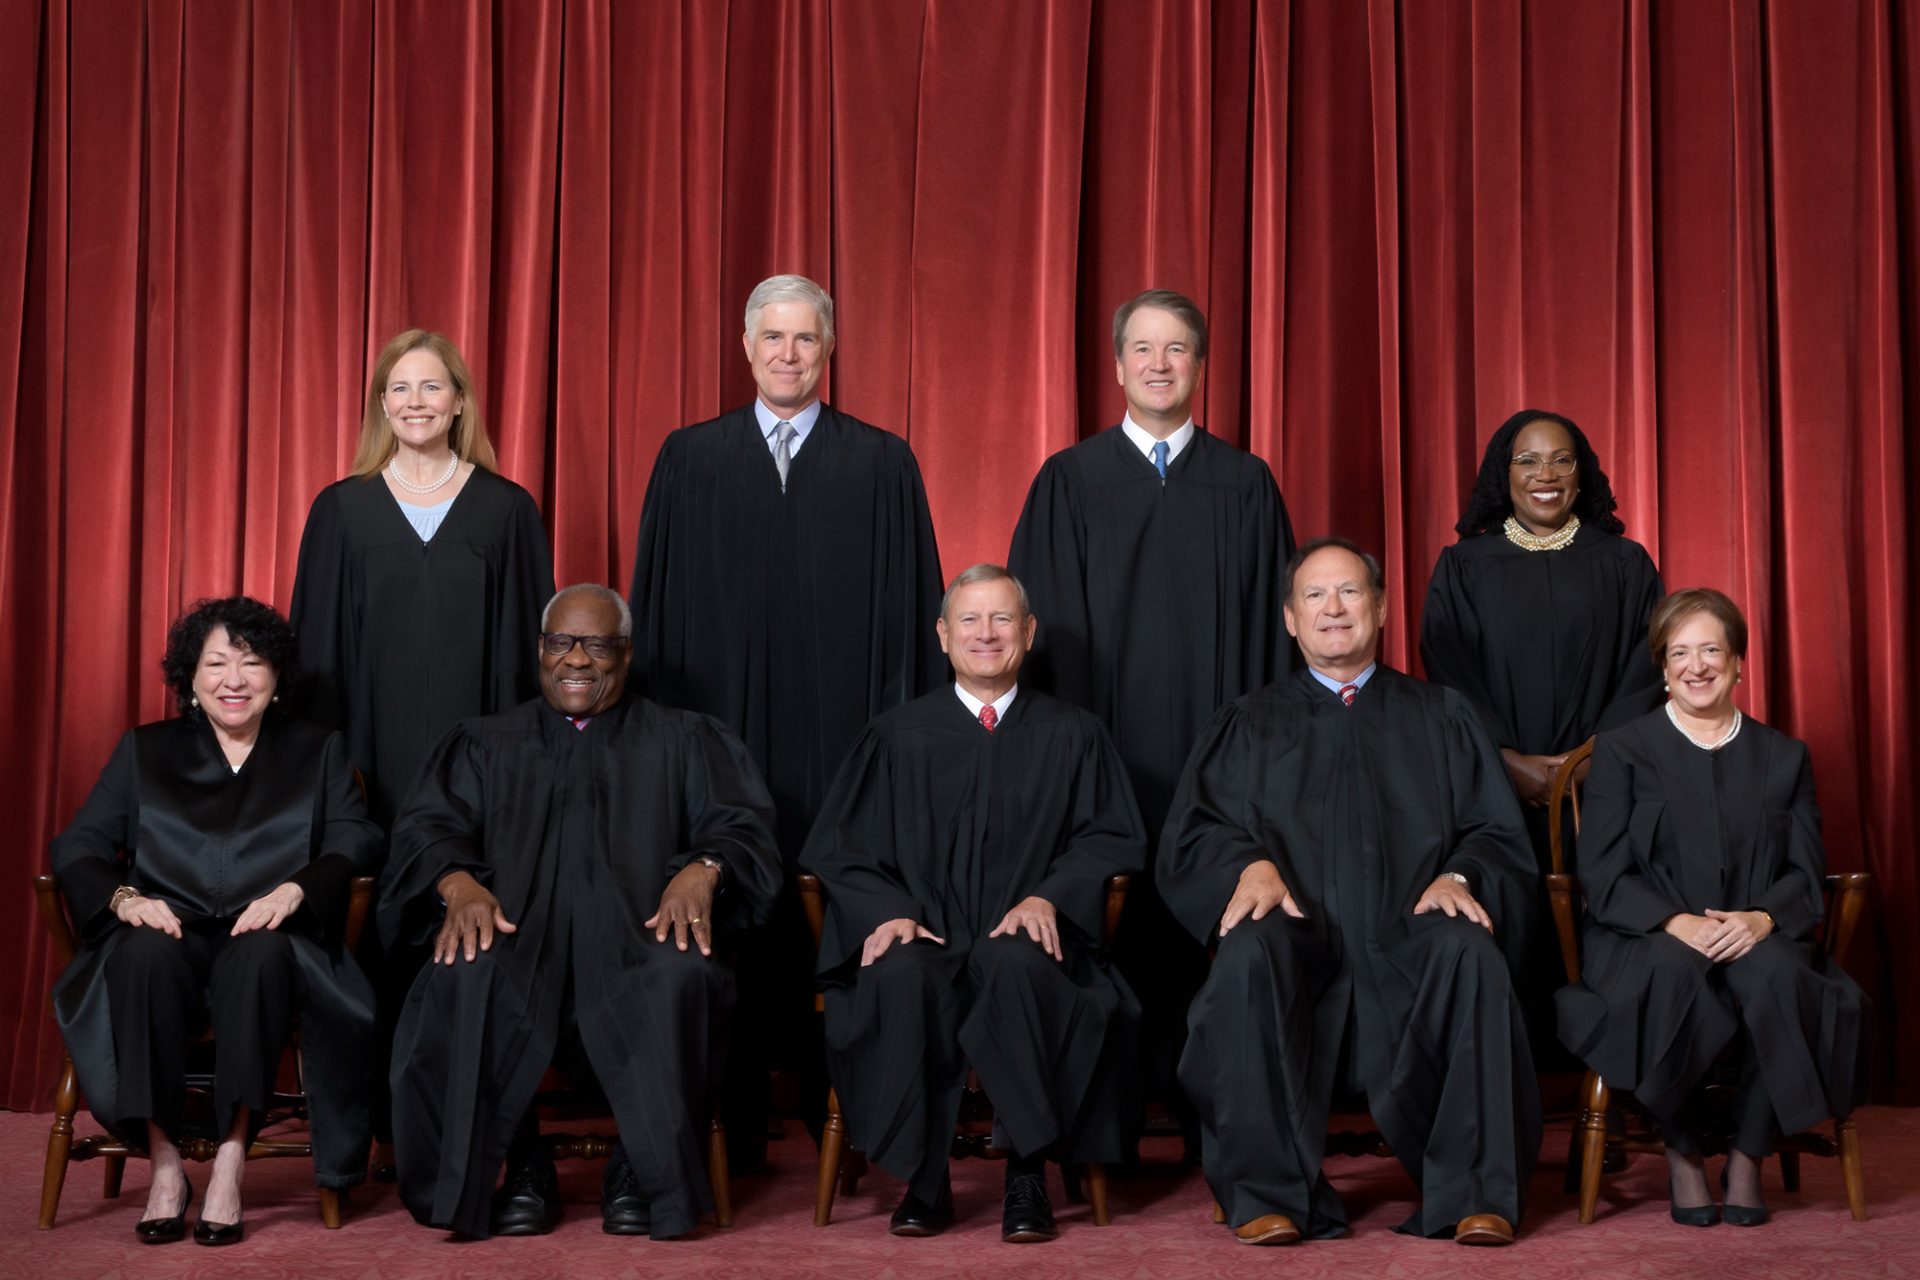
March is National Women’s History Month, an event with roots that started with female factory workers protesting working conditions in New York City in 1857.
The first International Women’s Day was celebrated in 1909, at the time of a global suffragette movement. Not until 1981 did the United States establish National Women’s History Week, when Sen. Orrin Hatch (R-Utah) and Rep. Barbara Mikulski (D-Maryland) co-sponsored the first Joint Congressional Resolution. In 1987, it was changed to the entire month of March. Traditionally, Congress passes a resolution recognizing Women’s History Month each year, and the President issues a proclamation.
Since the mid-1800s, women have truly “come a long way,” and now represent a majority of not only the U.S. population, but also the workforce in general, as well as management and professional occupations, according to the U.S. Census.
There are also more women-owned businesses which employ more workers of both sexes, and women are increasingly joining the military in both enlisted and officer ranks, lead their male counterparts in education and voting activity, and women account for exactly 100% of the 85.4 million mothers in the United States.
Unfortunately, women still trail men in earnings, with a median annual income of 77% of men.
Facts and Figures from the U.S. Census
- 158.3 million – The number of females in the United States in 2011. The number of males was 153.3 million.
- At age 65 and older, there were 13.3 percent more women than men in 2011.
Jobs
- 57.7% – Percentage of females 16 and older who participated in the labor force, representing about 72.6 million women in 2012.
- 41.7% – Percent of employed females 16 and older who worked in management, professional and related occupations, compared with 35.1 percent of employed males in December 2012.
Military
- 204,973 – Total number of active duty women in the military, as of Nov. 30, 2012. Of that total, 38,378 women were officers, and 164,021 were enlisted. ~ U.S. Department of Defense
Earnings
- $37,118 – The median annual earnings of women 15 or older who worked year-round, full time in 2011. In comparison, the median annual earnings of men were $48,202.
Source: Income, Poverty, and Health Insurance Coverage in the United States: 2011, Page 7 & 11. - 0.77 – The female-to-male earnings ratio in 2011. The number of men and women with earnings who worked year-round in 2011 was not statistically different from the ratio in 2010.
Education
- 31.4 million – Number of women 25 and older with a bachelor’s degree or more in 2011, higher than the corresponding number for men (30 million). Women had a larger share of high school diplomas (including equivalents), as well as associate, bachelor’s and master’s degrees. More men than women had a professional or doctoral degree.
- 30.1% – Percent of women 25 and older who had obtained a bachelor’s degree or more as of 2011.
- 11.3 million – Number of college students in fall 2011 who were women age 15 and older.
Businesses
- $1.2 trillion – Revenue for women-owned businesses in 2007.
- 7.8 million – The number of women-owned businesses in 2007.
- 7.5 million – Number of people employed by women-owned businesses in 2007.
- Nearly half of all women-owned businesses (45.9 percent) operated in repair and maintenance; personal and laundry services; health care and social assistance; and professional, scientific and technical services. Women-owned businesses accounted for 52.0 percent of all businesses operating in the health care and social assistance sector.
- 4 Number of states with at least 500,000 women-owned businesses in 2007 was California, Texas, New York and Florida. California had 1,039,208 women-owned businesses or 13.3 percent of all women-owned businesses in the United States, Texas had 609,947 or 7.8 percent, New York had 594,517 or 7.6 percent, and Florida had 581,096, or 7.5 percent.
Voting
46.2% – Percentage of female citizens 18 and older who reported voting in the 2010 congressional election. 44.8 percent of their male counterparts cast a ballot. Additionally, 66.6 percent of female citizens reported being registered to vote.
Motherhood
- 85.4 million – Estimated number of mothers in the United States in 2009.
- 1.9 – Average number of children that women 40 to 44 had given birth to as of 2010, down from 3.1 children in 1976, the year the Census Bureau began collecting such data.
- 81% – The percentage of women in this age group who had given birth was 81 percent in 2010, down from 90 percent in 1976.
Marriage
- 64.9 million – Number of married women 18 and older (including those who were separated or had an absent spouse) in 2011.
- 5.1 million – Number of stay-at-home mothers nationwide in 2012.
——–
More information on National Women’s History Month can be found at the National Woemen’s History Project website.
Thanks for reading CPA Practice Advisor!
Subscribe Already registered? Log In
Need more information? Read the FAQs
Tags: Accounting


