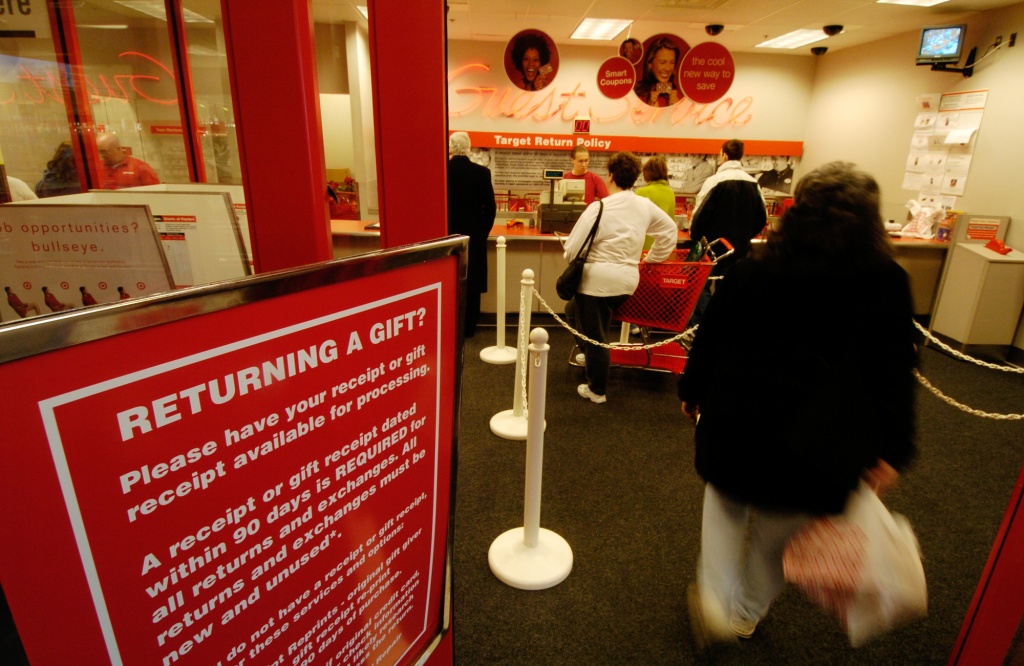
‘Tis the season … for con artists and thieves. Retail fraud comes in many shapes and sizes and is especially rampant during the holiday season when online and in-store traffic grows significantly.
One of the biggest issues throughout the holiday season: return fraud. According to the National Retail Federation’s latest Return Fraud Survey, retailers estimate that 3.5 percent of their holiday returns this year will be fraudulent, up slightly from the estimated 3 percent reported last year. Holiday return fraud is expected to cost retailers $2.2 billion, up from approximately $1.9 billion last year.
Retailers surveyed estimate that total annual returns will reach $260.5 billion, or 8 percent of total retail sales.
“Return fraud remains a critical issue for retailers with the impact spanning far and wide, in-store and online,” said NRF Vice President of Loss Prevention Bob Moraca. “While technology has played a significant role in deterring many in-person fraudulent transactions that would have otherwise gone unseen, there is little that can be done to prevent a determined criminal who will find a loophole one way or another. When it comes to retail fraud, retailers can build taller walls, but criminals continue to find taller ladders.”
When it comes to specific instances of return fraud, one problem stands out as the biggest offender: Nine in 10 retailers surveyed (91.9%) said they have experienced the return of stolen merchandise, similar to last year’s 92.7 percent. Wardrobing, or the return of used, non-defective merchandise, also presents a unique challenge year after year for retailers: three-quarters (72.6%) of those polled said they have experienced wardrobing in past year, on par with last year’s 72.7 percent.
The report does offer a glimmer of optimism though. According to the survey, fewer retailers in 2015 have experienced specific instances of return fraud, including:
- 75.8 percent have experienced the return of merchandise purchased on fraudulent tender, down from 81.8 percent in 2014;
- 71 percent have experienced return fraud made by known organized retail crime groups, down from 78.2 percent last year;
- 77.4 percent of retailers surveyed have experienced employee return fraud or collusion with external forces, down from 81.8 percent in 2014.
Given the growing use of e-receipts by retailers, the survey found a likely connection to fraud in this area. The survey found one-third (33.9%) of those polled said they have experienced return fraud with use of e-receipts, up from 18.2 percent last year.
“Retailers have the difficult task of providing superior customer service by always giving the benefit of the doubt to their shoppers when it comes to returns, while simultaneously working to make sure they protect their business assets,” continued Moraca. “We expect retailers to continue their tried and true ways of combating fraud through increased usage of identification verification, as well as seeking new and innovative approaches on the back end.”
Additional findings:
- Three in 10 (30%) surveyed said they have seen an increase in fraudulent purchases made with cash, while six in 10 (60.7%) have seen an increase in the use of gift card/merchandise credit return fraud.
- Eight in 10 retailers surveyed (85.2%) said they require identification when making a return without a receipt, up from 70.9 percent last year.
- Retailers surveyed said they estimate 10 percent of returns made without a receipt are fraudulent, up from an estimated 5 percent who said so last year. Just 1 percent of purchases made online and returned to stores are suspected to be fraudulent.
* NRF has revised its methodology for this report to use median data rather than averages, thus estimates from previous reports are no longer comparable. The data represented in this survey compares the median averages for both 2014 and 2015.
Thanks for reading CPA Practice Advisor!
Subscribe Already registered? Log In
Need more information? Read the FAQs
Tags: Accounting, Income Taxes


